Given the rapid growth in the number and success of mobile apps, most developers are looking for great ways to get the competitive edge that they need. One of the most important things for them is being able to find users, and keep them coming back to their apps again and again. Unfortunately, this can be quite a difficult task. In an effort to help with this goal, Google Analytics has created three new mobile app analytics reports.
Report 1: Active User Report
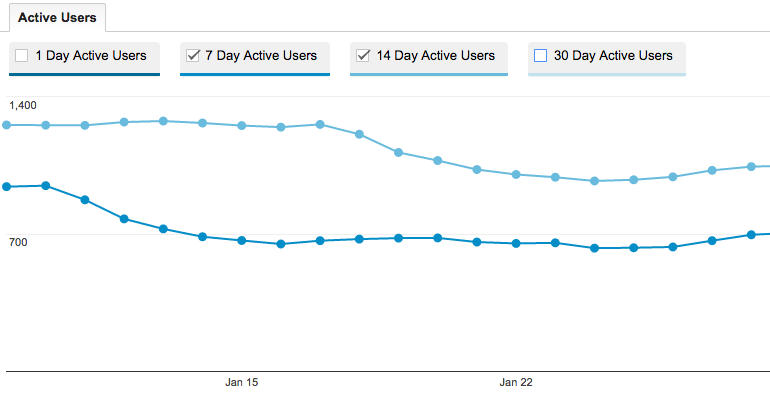
The first new report will display the number of active users over the past 1, 7, 14 and 30 days. All of this information is easily displayed on one graph, which can help you to identify trends and discover what types of things have been successful in driving new users, and bringing existing users back to your app. The report will look like this:

As you can imagine, being able to track the number of active users in this way will be very helpful with your overall marketing strategy. You’ll be able to easily gather the data you need, which will allow you to make more informed decisions about how to keep your app in use by users.
Report 2: Cohort Analysis Report
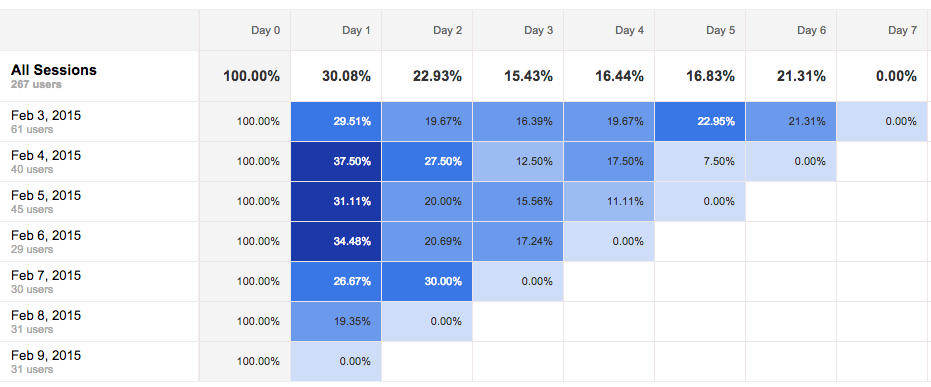
The next report is designed to identify when people come back to the app after the initial installation and use. This is extremely important for all app developers and promoters, but it is going to be especially useful for those who are using paid marketing to bring in new users. One of the biggest problems with paid marketing is that you get a lot of people who download and install the app, but then never use it again.
With the Cohort Analysis Report you will be able to see in one simple chart how many people are using your app during the days after it is installed. See how the chart will look here:

In addition to being able to see if people are coming back after the initial download, it will also help to show you whether or not certain strategies are working. For example, if you have an app pop-up notification after three days of non-use you will be able to quickly see whether or not that is bringing people back into the app. Similarly, if you send out an email to app users several days after the install, this report will be able to track how effective that can be.
Report 3: Lifetime Value Report
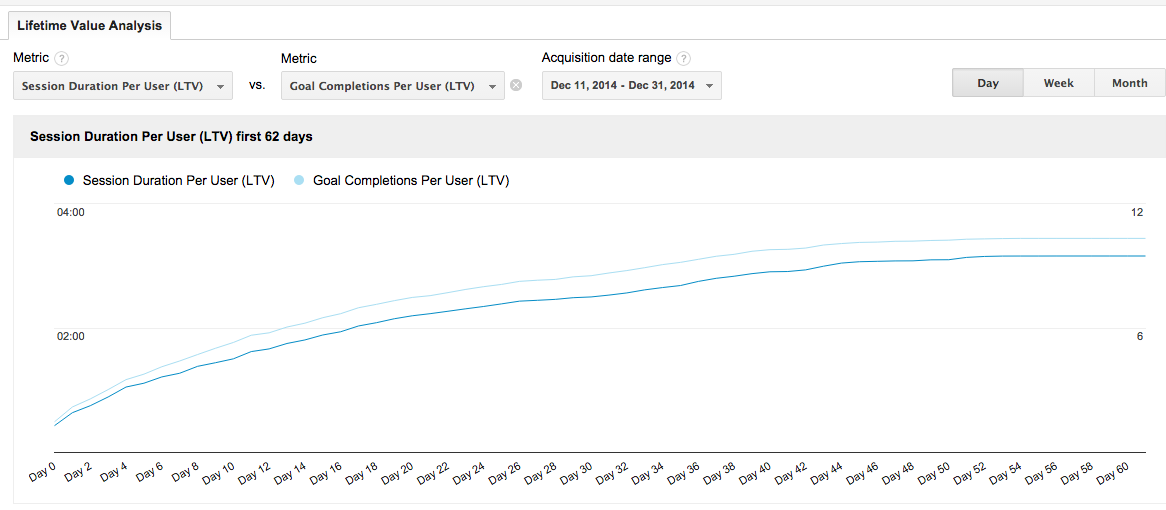
The final new report from Google Analytics is the Lifetime Value Report, which will help to get users to come back frequently with good marketing. This report shows how much each user of your app might be worth over the length of time that they are using the app. This report takes some setting up by identifying what type of user value you are looking for based on your specific objectives, but when done properly you can gain a lot of information.
For example, if your app is monetized by displaying ads, you can use this report to track how many screen views the average new users is seeing within 90 days of installing the app. You can also look into things like in-app purchases and much more. This is how your report will look:

Overall, these three apps are going to be extremely helpful for any app developers or people who promote mobile apps. The reports are technically still in Beta, which means there will likely be updates and improvements to them in the near future. To get started, however, you can look under the ‘Audience’ section in Google analytics.
